Map Reading Navigation for Air Cadets

The article below is an extract from the First Class Cadet Resource Book. Please note this information is subject to Copyright 2018 Thomas Grocott. Not for reproduction. Thomas Grocott has asserted his right to be identified as author of this work in accordance with the Copyright, Designs and Patents Act 1988. All rights reserved.Some images in this publication are Crown Copyright and contain public sector information licensed under the Open Government Licence v3.0.
Types of Map
The Ordnance Survey (OS) are the leading provider of maps in the UK and their maps come in a variety of different scales (level of detail) to suit
different uses. A map with a higher scale number covers a larger area but is less detailed than a map with a lower scale number covering a smaller area. Maps are a visual representation of the world, scaled down to a manageable size. Maps get changed on a regular basis because of actual changes on the land.
• Make sure the map you are using is as up to date as possible.
• There are many different types of map, each with different uses:
- Street maps - Road maps - Google maps - Military maps - Sketch maps - Atlas/ world maps - Local attraction maps - Town/ shopping maps
- Ordnance Survey maps
It is essential to keep your map clean and dry with a weatherproof map case.
Map Scales
A map scale is the ratio (in cm) between the distance on a map and the distance on the ground. Different scaled maps have different uses and it is important that you select the right one.
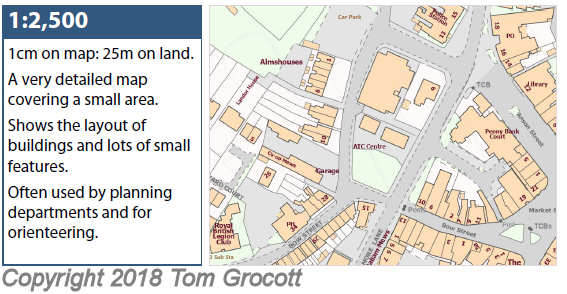
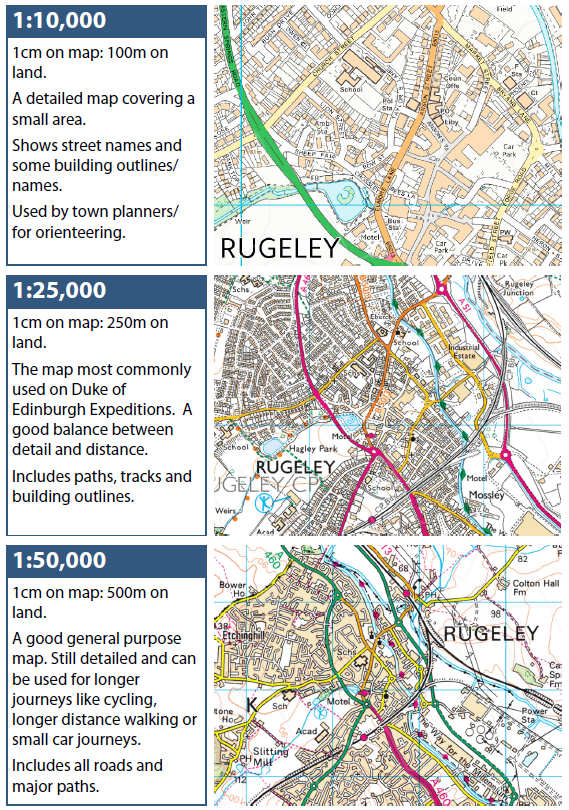
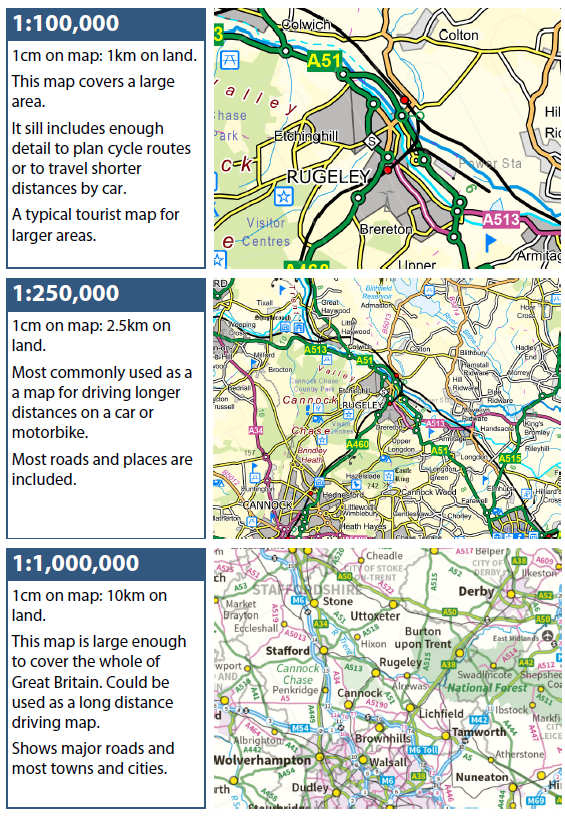

Map Symbols
Almost all maps will have a key which shows what the symbols on the map mean. These symbols can vary widely, depending on the maker of the map and what scale it is.
Map Keys
• The key of an OS map is usually found on the edge of the map. Remember, that the symbols are relevant only to the map you are using.
• Symbols and colours change across different manufacturers maps, and may even change across different versions. If in doubt about a symbol, check the key!
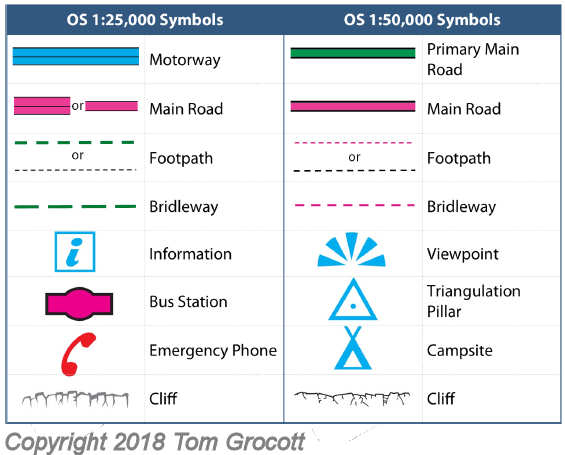
OS Map Symbol Examples
• The following table shows a few common OS 1:50,000 and 1:25,000 map symbols. For all symbols, look at the key on the right hand side of your paper map. The Ordnance Survey also publish their map keys online.

Grid References
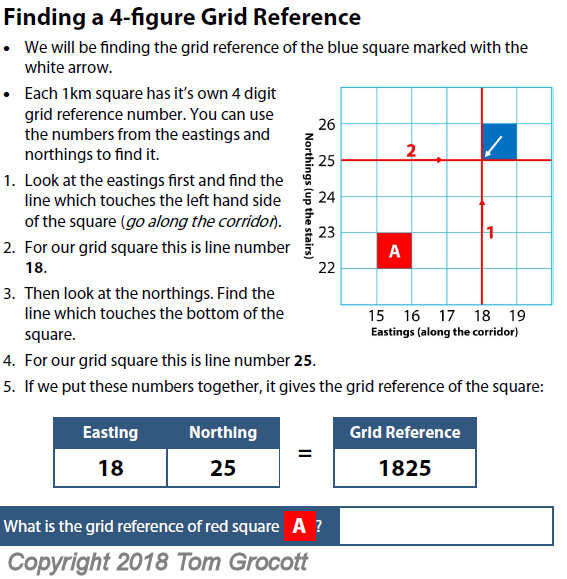
An OS map is split into different 1km by 1km squares, each of which has a unique reference on the map. This reference is called a grid reference, and is normally made up of four figures. To find a point on a map, a 6 figure grid reference can be used, which is more accurate. Grid lines on an OS map are spaced 1km apart, no matter what the scale. You can use the features on a good compass or protractor to help measure a grid reference:
• Vertical lines going along the map are called eastings. We can also call this the corridor as they go across the map.
• Horizontal lines going up the map are called northings. We can also call this the stairs as they go up the map.
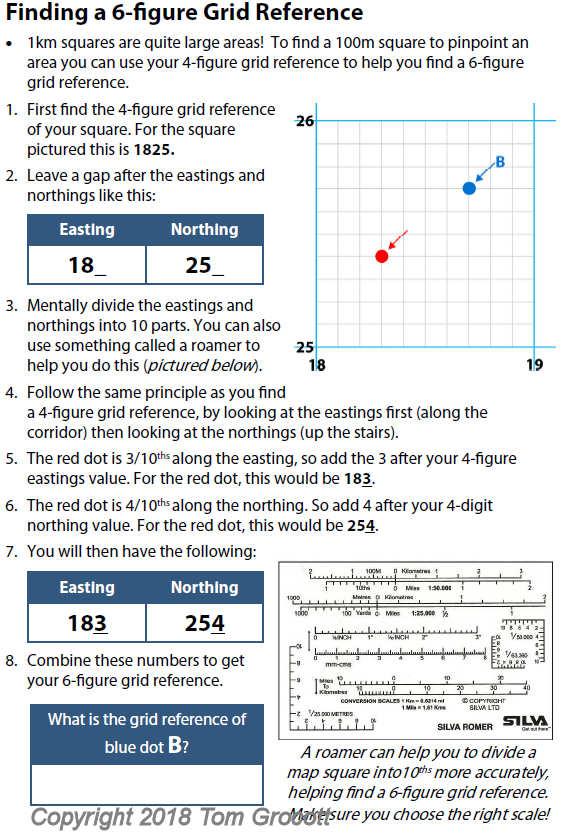
Finding a 6-figure Grid Reference
1km squares are quite large areas! To find a 100m square to pinpoint an area you can use your 4-figure grid reference to help you find a 6-figure
grid reference. First find the 4-figure grid reference:

Contour Lines
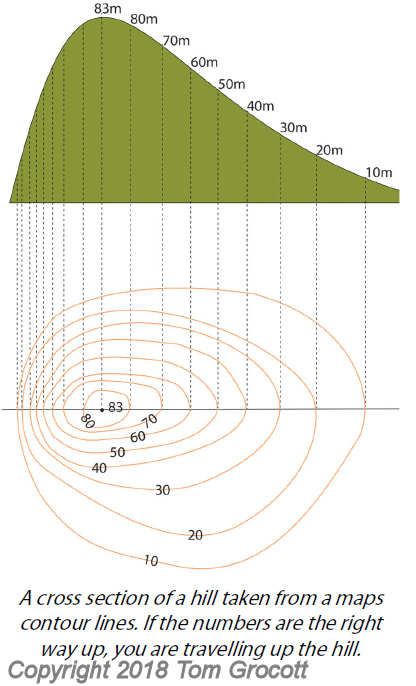
Contour lines are orange or brown coloured lines which join up areas of equal height together on a map. Contour lines very close together indicate a steep slope and contours further apart show a gentle slope. The numbers on contour lines show how metres land is above sea level.
• On 1:25,000 maps, contour lines are usually spaced in intervals of 5m of equal height.
• On maps in some hilly areas (like the Peak District) contour lines may been shown in 10m intervals. Its important that you check this before reading your map.
• It takes more time to walk up and down a hill than it does to walk the same distance without the hill.
• High points may be marked on the map with a black dot or a triangulation pillar.
Differences in Height
• To work out differences in height, just measure the difference between the highest and lowest point you want to travel to.
• For example, If you were 40m up the hill pictured right an wanted to find out how many metres it was to the top, you could look at the map, and notice the top of the hill is 83m.
• To find the difference in height, subtract 40m from 83m as follows: 83m-40m= 43m
• Therefore, the difference in height is 43m.

As well as showing areas of equal height, the shape of contour lines on a map can help readers identify different land features on the ground. Below are some common land features and what they look like on a map and on the ground.
• Widely spaced counter lines indicate a gradual, shallow slope. Tightly spaced contour lines indicate a steep slope. As well as being gradual or
steep, slopes may be convex or concave.
• Often a hill can be both convex and concave in different areas. If contours are more evenly spaced then a slope will be more uniform, or ‘straight’.
Convex Slopes
• A convex hill’s contours are more tightly spaced at the bottom of the hill than the top, meaning it is the steepest at the bottom.
Concave Slopes
• A concave hill’s contours are further apart at the bottom of the hill than the top, meaning the hill gets steeper as you climb. This makes it difficult to see where the summit of the hill is whilst walking!
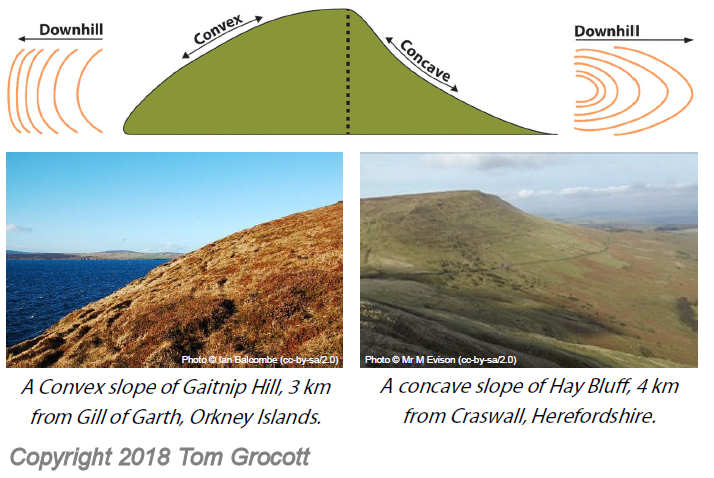
Features on some of the following maps are annotated in red. The maps are not to scale and are different sizes, depending on features shown.
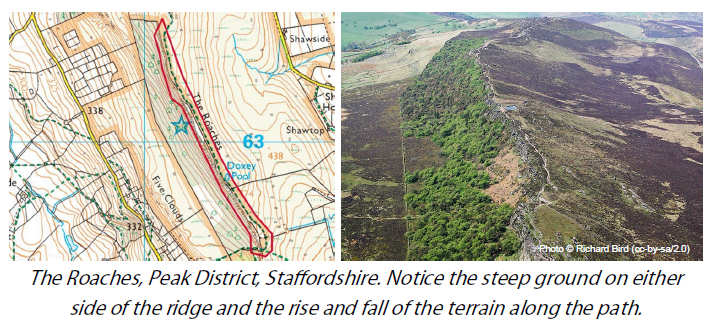
Ridge
• A ridge is a long narrow hilltop or mountain range. You will often find rocky outcrops along a ridge.
• On the example below a path goes across the top of the ridge.
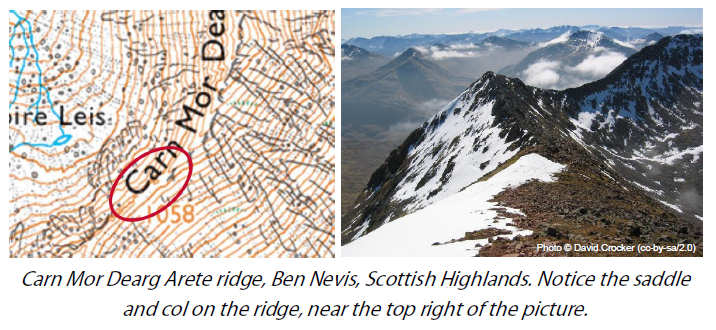
Saddle and Col
• A saddle is a dip between two peaks in a ridge or pair of hills.
• When a ridge has a peak at each end, the lowest part on the ridge between the summits is called a col.
• These are sometimes hard to spot. Look for a ‘gap’ in the contour lines. This represents a dip in the ground.
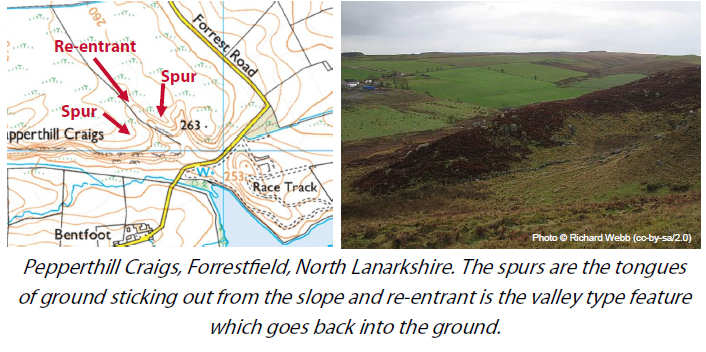
Spur and Re-entrant
• A spur is a ridge or ‘tongue’ of ground which comes out from a hill or mountain.
• A re-entrant is a narrow valley closed at one end. Re-entrants separate spurs and show the ‘entering’ of the land into the hill.
• Both of these features have a hairpin type shape.
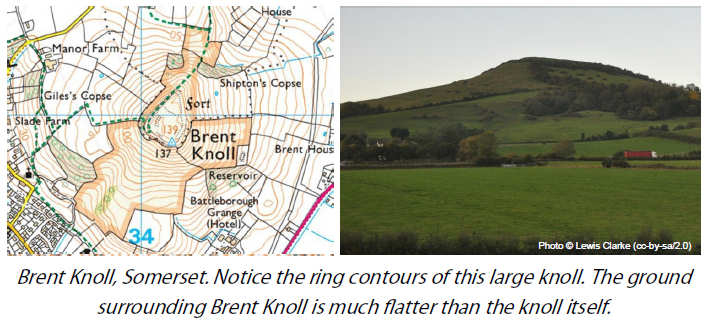
Knoll
• A low isolated hill with it’s own ring contour pattern. Also known as a hillock.
• Some are much smaller than Brent Knoll, and may only have one contour line, or even a dot to show its place on the map.
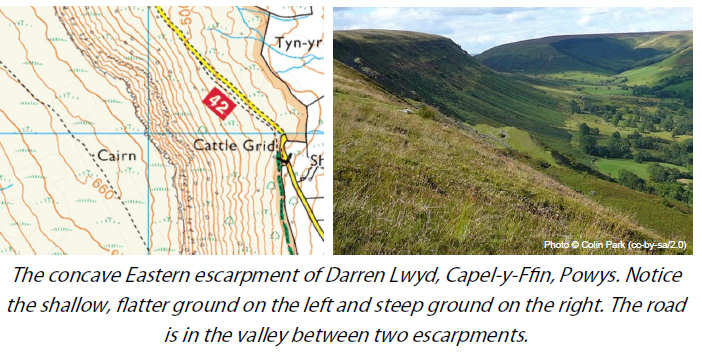
Escarpment
• An escarpment is a landform with a steep slope on one side and a much more shallower slope/ plateau on the other side.
• They separate land of different height, but are not as steep as a cliff.
Summary
Contour lines show areas of equal height on a map.
• They are normally shown in intervals of 5m, but sometimes in intervals of 10m if the area has steep hills or mountains.
• Convex hills are the steepest at the bottom of the slope - they become easier to climb as you gain height.
• Concave slopes are steepest at the top - this sometimes makes it difficult to see the top of the hill as you climb.
• Contours illustrate different land features and can provide vital clues to help pinpoint your location on a map.

The article above is an extract from the First Class Cadet Resource Book. Please note this information is subject to Copyright 2018 Thomas Grocott. Not for reproduction. Thomas Grocott has asserted his right to be identified as author of this work in accordance with the Copyright, Designs and Patents Act 1988. All rights reserved.Some images in this publication are Crown Copyright and contain public sector information licensed under the Open Government Licence v3.0.

